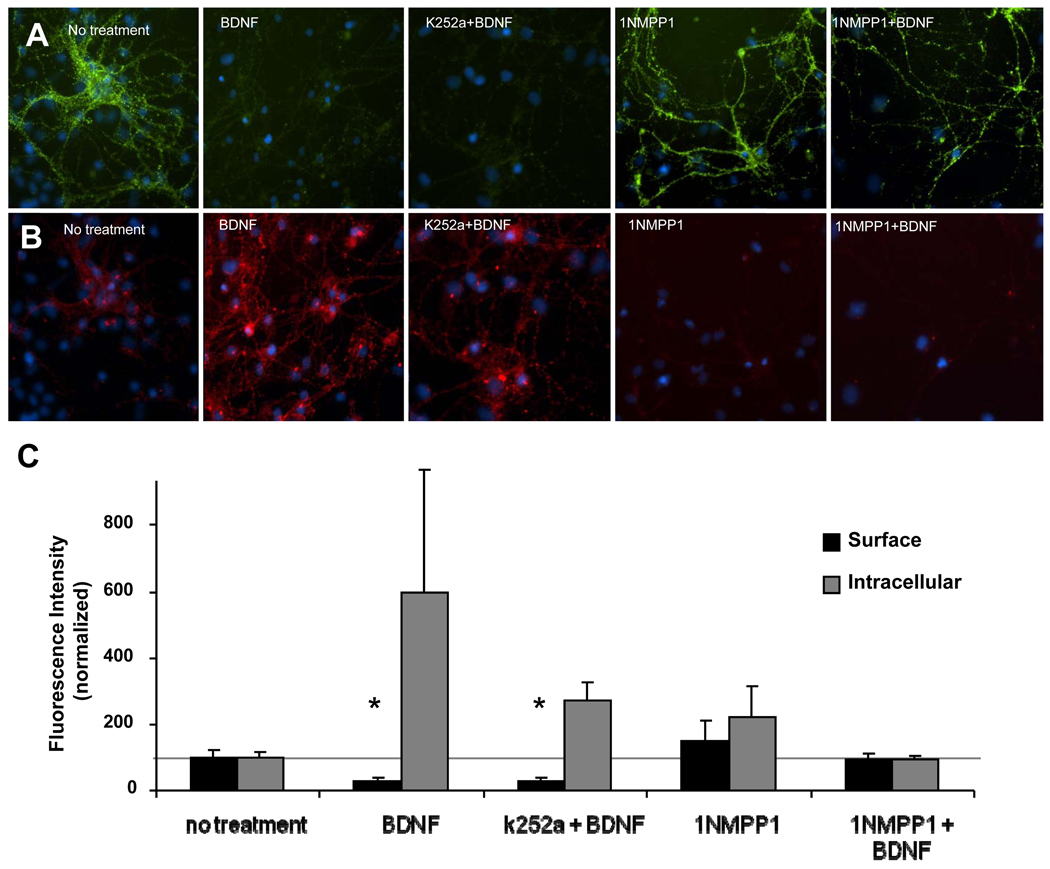
Figure 7. BDNF-dependent decrease in surface GABAARα1 in TrkBF616A amygdala cultures.
Panel A illustrates light microscopic images of surface (green) GABAARα1 subunits following treatment with vehicle, BDNF, K252a + BDNF, 1NMPP1, or 1NMPP1 + BDNF. Panel B illustrates images of intracellular (red) GABAARα1 subunits following the same conditions as in (A). Panel C demonstrates quantification of fluorescence intensity of surface (black) or intracellular (gray) GABAARα1, normalized with controls. (Mean ± SEM of normalized intensity, * p<0.02, relative to no treatment).

