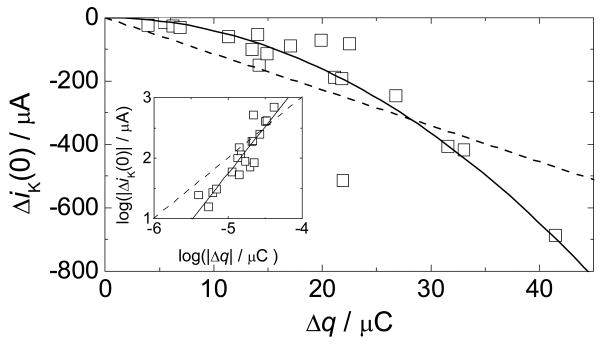
Figure 2.
Difference in kinetic currents for O2 reduction with and without Cu, ΔiK, at 0 mV vs. NHE, for different Cu(phenC) coverages as measured by the redox charge Δq. The solid line is the best fit of the form y = ax2. The dashed line is the best fit of the form y = ax. The inset is a log-log plot of the same data. The solid line in the inset is a linear fit with slope = 1.98. The dashed line has slope = 1 for comparison.

