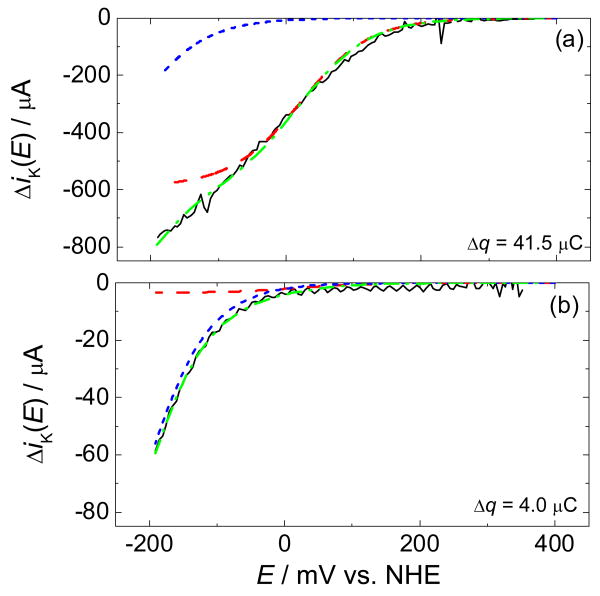
Figure 4.
Difference in kinetic currents for O2 reduction with and without Cu, ΔiK, (a) high coverage (Δq = 41.5 μC) and (b) low coverage (Δq = 4.0 μC). The solid black line is the measured ΔiK. The dash-dotted green line is a proposed fit to the data comprised of the sum of the potential-dependent currents from two competing pathways (Equation 8): a binuclear 4-electron O2-reduction pathway (red dashed) and a mononuclear 2-electron O2-reduction pathway (blue dotted).

