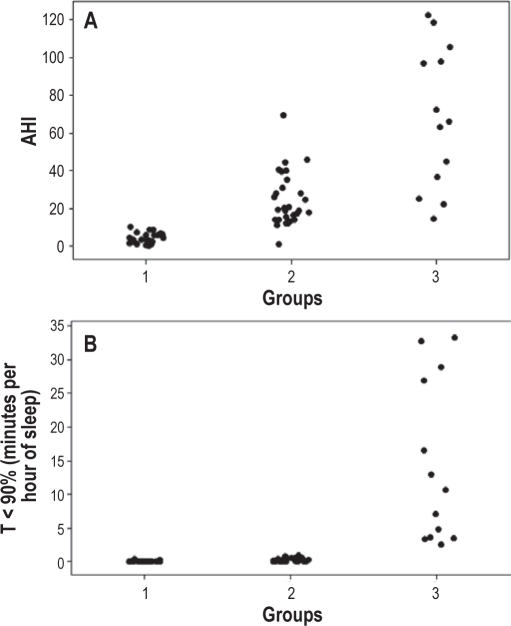
Figure 3.
Shown below are the apnea-hypopnea index (AHI) and desaturation times of groups 1-3
Group 1: no obstructive sleep apnea (OSA) (n = 27), Group 2: OSA, but minimal desaturation (time spent at an SaO2 of < 90% [T < 90%] was < 1 min/h of sleep, n = 29), and Group 3: OSA and desaturation (T < 90% was ≥ 1min/h of sleep, n = 13).

