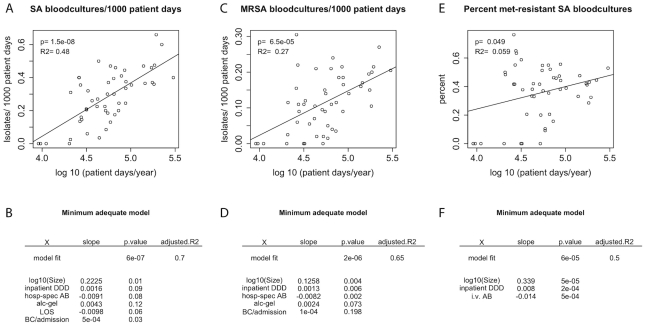
Figure 3. Correlations between hospital size and incidence rates or resistance in Ireland 2006–2007.
Size = Patient days/year; inpatient DDD = Mean defined daily doses given to inpatients per 100 patient days; hosp-spec AB = Mean defined daily doses of hospital specific antibiotics/100 patient days; in. AB = Mean defined daily doses of injectable antibiotics/100 patient days; alc-gel = Mean consumption of alcohol-based hand gels in L/1000 patient days; BC/admission = Mean number of bloodcultures per 1000 admissions. A) Mean total incidence rate of blood cultures positive for S. aureus as a function of hospital size, the line represents the univariate linear model of incidence rate against hospital size B) Minimum adequate model explaining the total incidence rate C) Mean incidence rate of blood cultures positive for methicillin-resistant S. aureus (MRSA) as a function of hospital size, the line represents the univariate linear model of incidence rate against hospital size D) Minimum adequate model explaining the incidence rate of MRSA E) Mean percentage of MRSA among all S. aureus bloodstream isolates F) Minimum adequate model explaining the percentage of methicillin-resistant infections as a function of hospital size, the line represents the univariate linear model of percent resistant isolates against hospital size.

