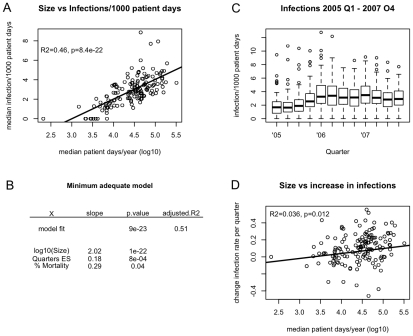
Figure 4. Correlations between hospital size and incidence rates and their increase in Pennsylvania 2005–2007.
A) Median quarterly incidence rate of nosocomial (>48h after admission) infections as a function of hospital size, the line represents the univariate linear model of incidence rate against hospital size B) Minimum adequate model explaining the incidence rate of nosocomial infections C) Quarterly incidence rates of noscomial infections in Pennsylvania 2005–2007 D) Change in incidence rates from 2005–2007. Here, a linear model was fitted to the quarterly incidence rates for each hospital. For each hospital, the slope of this regression (controlled for the introduction of electronic surveillance) was plotted against the number of patient days per year. In order to determine the correlation between the change in incidence rates and hospital size, the slopes were set to zero if there was no significant trend during the observed period.

