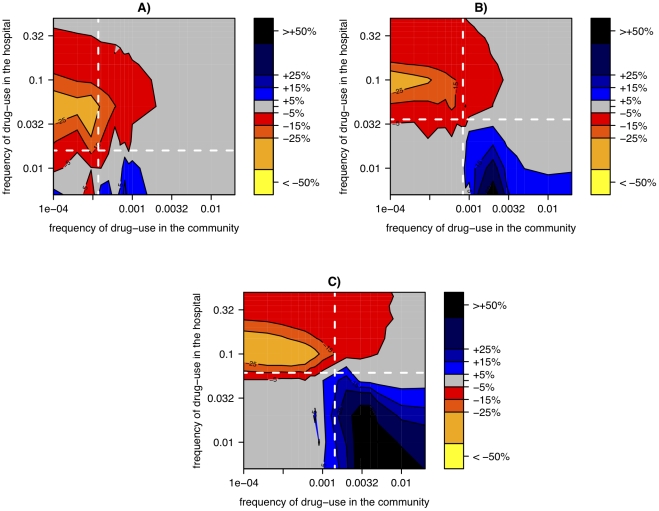
Figure 6. Relative change of resistance-prevalence in small vs. large hospitals linked to a panmictic community.
The relative change in resistance-prevalence is measured as  and is plotted as a function of the frequency of drug-use in the hospital and the community. Panels correspond to different costs of drug resistance: s = 0.1 (A), s = 0.2 (B), s = 0.3 (C). The resistance prevalence for each parameter combination has been computed as the average over 500 simulations. The white lines correspond to the threshold values when R0 of the resistant strain becomes higher than R0 of the wild-type strain in the hospital (horizontal) and the community (vertical).

