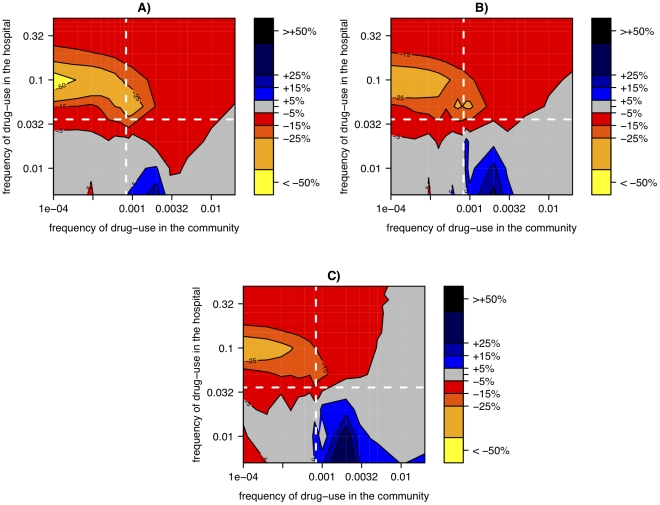
Figure 7. Relative change of resistance-prevalence in small vs. large hospitals linked to a subdivided community.
The relative change in resistance-prevalence is measured as  and is plotted as a function of the frequency of drug-use in the hospital and the community. Panels correspond to different migration rates between sub-communities: m = 1%/year (A), m = 5%/year (B), m = 20%/year (C). The cost of resistance was set to 0.2 (corresponding to Figure 6B). The resistance prevalence for each parameter combination has been computed as the average over 500 simulations.

