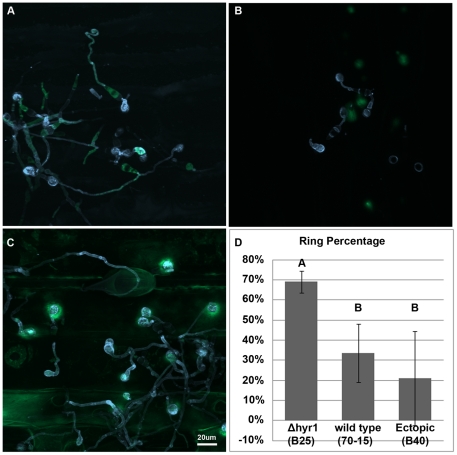
Figure 5. More ROS was produced when leaves were inoculated with Δhyr1 mutant conidia, versus wild type.
(A) Conidia of wild type (70-15), (B) ectopic (B40) and (C) Δhyr1 (B25) were inoculated onto the surface of a barley leaf and then stained with calcofluor white for fungal cell walls and DCF for the ROS, 24 hpi and imaged by confocal microscopy. (D) Around 35 Appressoria were counted for each line, along with the number of appressoria showing ROS haloes, and percentages were generated. This experiment was repeated ten times with similar results. Different letters over the bars indicate a significant difference as determined by a student's t-test, and a p-value of ≤0.05. Scale bar = 20 µm for all images.

