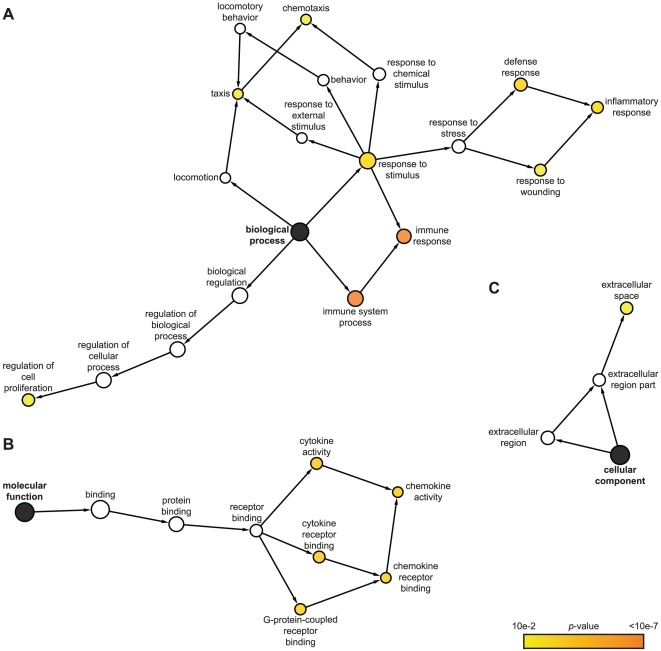
Figure 2. Predominant functional themes among IE1-activated genes.
Cytoscape (http://www.cytoscape.org [219], [220]) and the Biological Networks Gene Ontology (BiNGO) plugin (http://www.psb.ugent.be/cbd/papers/BiNGO [221]) were used to map and visualize overrepresented terms in the IE1-activated human transcriptome on the GO hierarchy. Spatial arrangement of nodes reflects grouping of categories by semantic similarity. The node area is proportional to the number of genes in the reference set (“GO Full”, Homo sapiens) annotated to the corresponding GO term. The yellow to orange node color indicates how significantly individual terms are overrepresented (p≤0.01; hypergeometric test including Benjamini and Hochberg False Discovery Rate correction [222]). White nodes are included to show the colored nodes in the context of the GO hierarchy and are not significantly overrepresented. Black nodes represent the three GO domains: A) biological process, B) molecular function, and C) cellular component.

