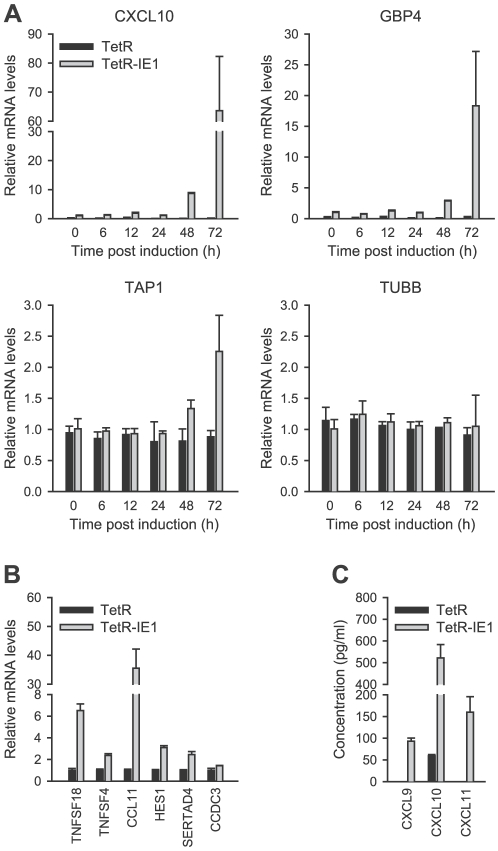
Figure 3. Confirmation of IE1-induced gene expression.
A) TetR and TetR-IE1 cells were treated with doxycycline for 0 to 72 h as indicated. Relative mRNA expression levels were determined by qRT-PCR with primers specific for the CXCL10, GBP4, TAP1, and TUBB genes. Means and standard deviations of two replicates are shown in comparison to uninduced TetR-IE1 cells (set to 1). B) TetR and TetR-IE1 cells were treated with doxycycline for 72 h. Relative mRNA expression levels were determined by qRT-PCR with primers specific for the indicated genes. Means and standard deviations of two biological and two technical replicates are shown in comparison to TetR cells (set to 1). C) Quantification of the CXCR3 ligands CXCL9, CXCL10, and CXCL11 in the supernatant of IE1 expressing cells. Growth-arrested TetR and TetR-IE1 cells were treated with doxycycline for 72 h. The culture medium was replaced by 0.5 volumes of doxycycline containing DMEM with 0.1% BSA, and chemokine protein accumulation was determined 24 h later by quantitative sandwich enzyme immunoassay. Means and standard deviations of two biological and two technical replicates are shown.

