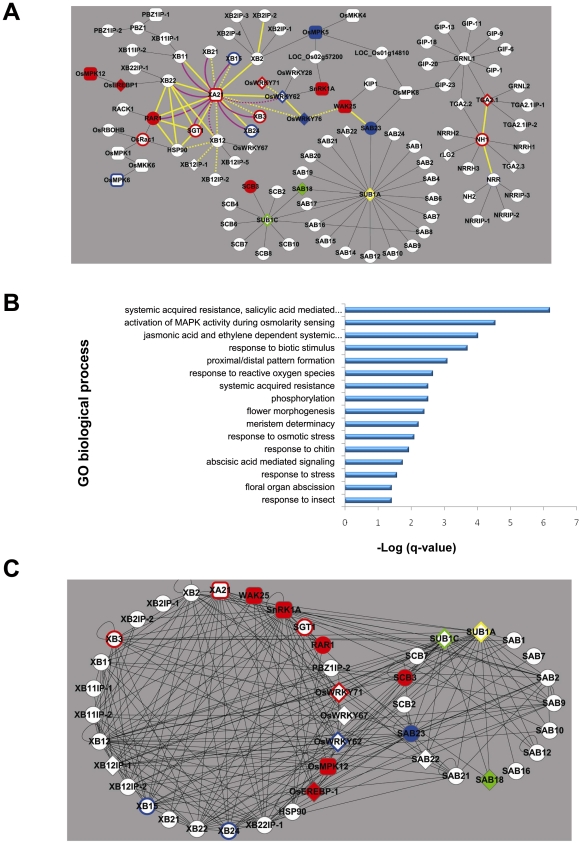
Figure 1. Construction, validation, and characterization of the rice stress-response interactome.
(A) The XA21/NH1/SUB1 interactome as determined by Y2H cDNA library screening, interactions reported in the literature, and targeted Y2H assays (Text S1). Interactions shown by Y2H or in the literature, only, are represented by thin black edges (lines). Physical validation of the Y2H-based interactome was performed by either mating-based split ubiquitin system (purple edges: solid indicates an interaction was measured and dashed indicates no interaction was measured, Figure S1) or bimolecular fluorescence complementation (yellow edges: solid indicates an interaction was measured and dashed indicates no interaction was measured, Figure S2, Table S3). Response to Xanthomonas oryzae pv. oryzae (Xoo) challenge or submergence treatment was assessed for 24 members of the interactome (Text S1, Table S7). Nodes (proteins) that act as positive regulators of resistance to Xoo are shown in red (filled represent function shown in this study and outline represent function shown in the literature. Nodes that act as negative regulators of resistance to Xoo are shown in blue (filled: this study; outline: literature). Yellow and green nodes represent proteins that act as positive and negative regulators of tolerance to submergence, respectively (filled: this study; outline: literature). Nodes depicted as rounded rectangles and diamonds represent kinases and transcription factors, respectively. (B) Enrichment of gene ontology (GO) biological processes among interactome component proteins. The significance of enrichment for total of 1,042 GO terms was calculated by Fisher exact test, then obtained p-values were adjusted for multiple hypothesis testing by q-value [22]. Sixteen of 1,042 GO biological process terms were enriched by q <0.05 (represented as –log (q) in the bar graph, Table S2). (C) Protein-protein interaction map based on measurement of the matrix of interactions among and between 27 components of the biotic (XA21) stress-response and 16 components of the abiotic (SUB1) stress-response interactomes. Node colors and shapes are as in Figure 1A.

