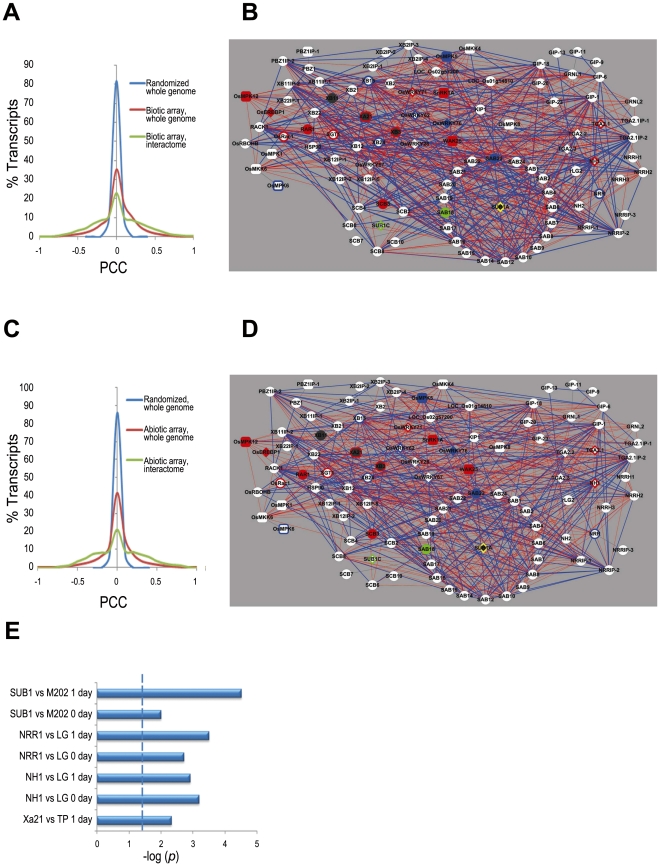
Figure 2. Transcriptome context for the rice stress interactome.
(A) Distribution of Pearson's correlation coefficient (PCC) values calculated from the 179 biotic stress Affymetrix arrays data (listed in Table S5) for the interactome components only (green line), all genes in the rice genome (red line) and all rice genes with the array data randomized (blue line), demonstrate that the expression of the interactome members is highly correlated compared to that of all rice genes. (B) Coexpression network of interactome based on the biotic stress arrays (listed in Table S5). Red edges indicate positive correlations (PCC > 0.5) and blue edges indicate negative correlations (PCC <−0.5). Node shapes and colors are as in Figure 1A except the purple filled nodes, which indicates the genes for which we were unable to calculate PCC due to lack of unique probes. (C) Distribution of PCC as for (A) but with the abiotic stress Affymetrix arrays (Table S5) (D) Coexpression network as for (B) but with the abiotic stress arrays. (E) Enrichment test of interactome genes in NSF45K array data by Fisher exact test. The significance level of p-values <0.05 is indicated by dashed line. M202 vs. Sub1A::Sub1A vs. is a comparison of the cultivar M202 with a near isogenic line in which the Sub1 locus has been introgressed [32]. LG vs. Ubi::Nrr is a comparison of the cultivar LiaoGeng (LG) and LG transgenic line #64 that overexpresses NRR from the maize ubiquitin promoter. LG vs. Ubi::Nh1 is a comparison of LG and LG transgenic line #11that overexpresses NH1. TP vs. Xa21::Xa21 is a comparison of the cultivar Taipei309 (TP) and TP transgenic line #106-17-3-37 that expresses Xa21 from the Xa21 native promoter. ‘0 day’ indicates that the sample was taken immediately before stress initiation (i.e., submergence or Xoo-inoculation). ‘1 day’ indicates that the sample was taken approximately 24 hours after application of stress.

