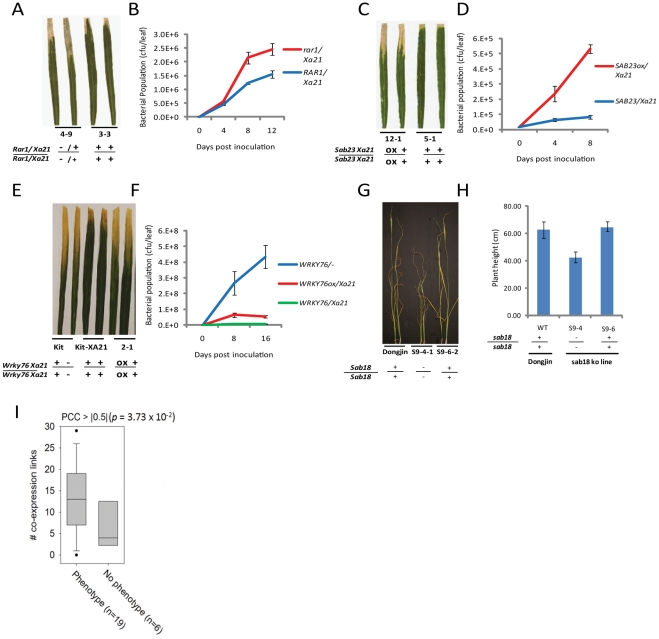
Figure 3. Representative evidence that interactome components function in rice stress responses.
(A–B) Challenge of rar1 (knockout)/Xa21 (IRBB21) F2 segregants with Xoo (PR6) reveals that RAR1 is a positive regulator of XA21 signaling (see also Figure S6). (A) Water-soaked disease lesions 14 days post inoculation (dpi) of rar1/Xa21 leaves (plant 4–9) compared to Rar1/Xa21 leaves (plant 3-3). (B) Xoo population growth over 12 days of infection from three representative leaves per time point from rar1/Xa21 vs. Rar1/Xa21 F3 segregants. (C–D) Challenge of Ubi::Sab23/Xa21 (IRBB21) F3 segregants with Xoo reveals that SAB23 negatively regulates XA21-mediated defense (see also Figure S7). (C) Water-soaked disease lesions 14 dpi of Ubi::Sab23/Xa21 leaves (plant 12-1) compared with Xa21 leaves (plant 5-1). (D) Xoo population growth over 12 days of infection from three representative leaves per time point from Ubi::Sab23/Xa21 vs. Xa21 F3 segregants. (E–F) Challenge of T2 Ubi::Wrky76/Xa21 Kitaake (Kit) plants with Xoo reveals that WRKY76 negatively regulates XA21-mediated defense (see also Figure S11). (E) Water-soaked disease lesions 14 dpi of Ubi::Wrky76/Xa21 leaves (plant 2-1) compared to Xa21-Kit leaves. (F) Xoo population growth over 14 days of infection from three representative leaves per time point from Ubi::Wrky76/Xa21-Kit T1 plants vs. Xa21-Kit. (G–H) Submersion of sab18 (knockout) plants reveals that SAB18 functions as a negative regulator of submergence tolerance (see also Figure S13). (G) Shoot elongation response of sab18 Dongjin (plant S9-4-1) compared to Dongjin (wild type) and null segregant (S9-6-2) after 14 days of submergence (H) Shoot elongation of sab18 Dongjin (line S9-4) compared with sab 18 null segregant (S9-6) and wild type after 14 days of submergence. (I) Degree distributions by coexpression network, in which links are defined by PCC > |0.5| based on 219 abiotic microarrays, for interactome genes with phenotypic effect or no phenotypic effect. Genes encoding interactome components with phenotypic effects show a significantly higher degree distribution than genes with no phenotypic effect (p<0.04, Wilxoson signed rank test).

