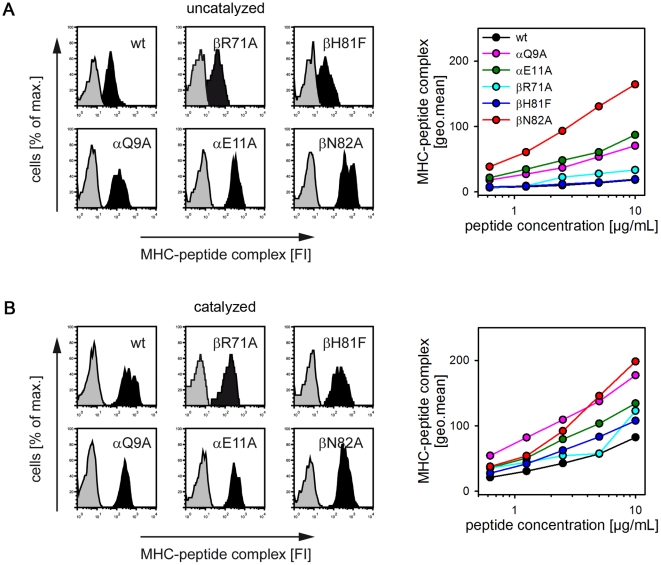
Figure 7. Influence of the putative βN82-lock on the receptiveness of cell surface MHC II.
A, Surface loading of HLA-DR1-expressing fibroblast cells. Full-length forms of wt and mutant HLA-DR1 were expressed in L929 fibroblast cells. In an in vitro loading assay [10], cells were incubated for 4 h with biotin-labeled HA306-318. Cell-surface loading of HLA-DR1 with peptide was analyzed by FACS after staining with APC-streptavidin. Representative histogram plots (right panels) are shown depicting the fluorescence recorded in the absence (grey) or presence of the biotinylated HA306-318 peptide (black). Dose response curves for titrated amounts of the peptide are shown in the right panels for wt HLA-DR1 (black), αQ9A (magenta), αE11A (green), βR71A (light blue), βH81F (dark blue), and βN82A (red). B, Cell surface loading in the presence of MLE. The same experiments as described in Fig. 6A were carried out in presence of the MLE compound AdEtOH.

