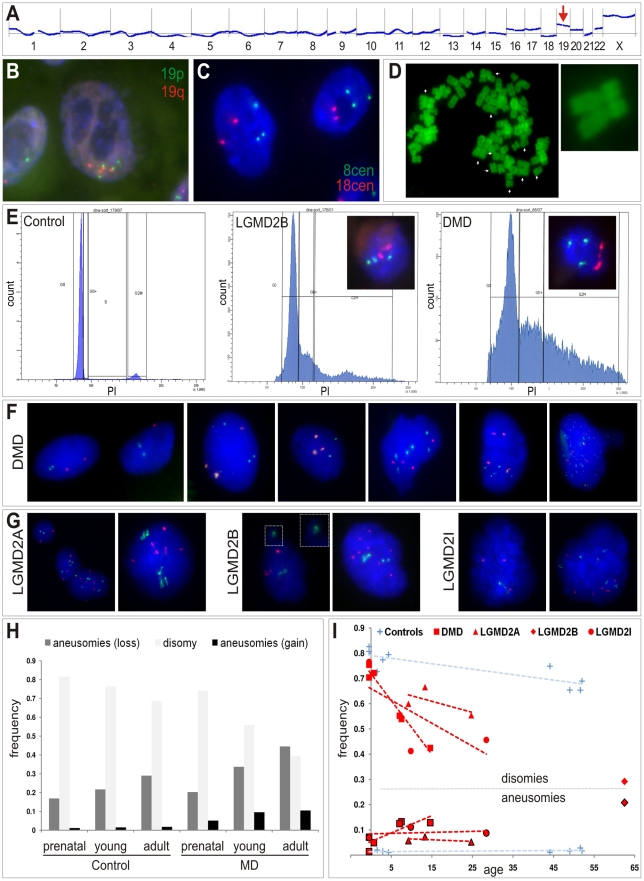
Figure 4. Somatic aneuploidy in human muscular dystrophies.
(A) Agilent aCGH profile (50 Mbps moving average) of cultured human myoblasts from a female LGMD2B patient (“90/01”). Mean-fold changes (compared to pooled DNA from n = 6 healthy male controls) were highly suggestive for gains of several chromosomes, especially for chromosome 19 (arrow). (B,C) I-FISH on myoblasts verified the presence of nuclei with aberrant chromosome 19 (tetrasomy shown in B) and chromosome 8 counts (trisomy shown C). (D) Diplochromosome formations (arrows) in a metaphase spread prepared from DMD myoblasts. (E) DNA content analyses by FACS profiling of propidium iodide (PI)-stained myoblasts from DMD and LGMD2B patients revealed abnormally high proportions of nuclei with aberrant chromatin content indicated by highly prominent G0+ peaks compared to the control myoblast line. Insets show targeted FISH analyses of nuclei isolated through sorting G0+ peaks, which verified the presence of chromosome 8 trisomies (green: 8cen, red: 18cen). (F,G) Interphase FISH on nuclei isolated from cryofixed skeletal muscle tissue from DMD patients (F) and LGMD2A, LGMD2B and LGMD2I patients (G), probed with chromosome 2p (red) and chromosome 19q (green) probes. Close-up in one LGMD2B example depicts micronucleus formation. (H) Frequency histogram of chromosome 2p and 19q aneusomies (gains, black, and losses, dark grey) compared to the normal disomic configuration (light grey) in prenatal, young, and adult patients with MD and healthy controls. (I) Age-dependent decline of normal disomic configuration (chromosome 2p and 19q) and increase of aneusomies in skeletal muscle from MD patients (red, as indicated) in contrast to controls (blue). Outlined symbols correspond to aneusomies. Dashed lines indicate linear trends.

