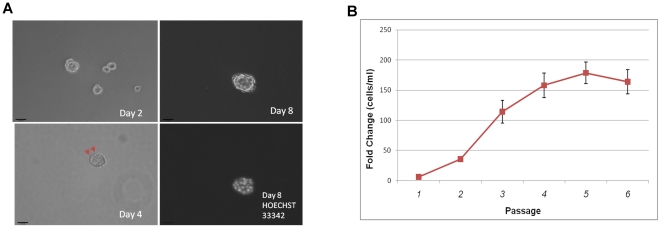
Figure 1. Establishment of tumorspheres from MCF7.
A. Phase contrast images of tumorspheres derived from MCF7 cells 2, 4, and 8 days after initial seeding. Red arrows (bottom left) indicate microspikes, which are presumed to be microfilaments that spheroid cells use to sense nutrients in the environment. Hoechst nuclei staining (bottom right) shows a multicellular tumorsphere. Magnification at 100x. Scale bar = 100 microns. B. Growth kinetics of MCF7S. Cells were seeded at 10,000 per ml and allowed to grow for seven days. The cells were then dissociated, counted, and passaged on the seventh day. This was repeated for 6 weeks. The experiment was performed twice with technical triplicates each time. Fold change is shown as final cell density/initial cell density.

