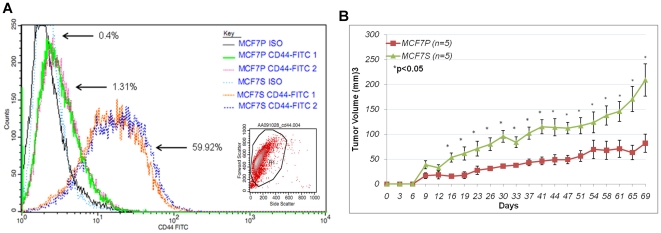
Figure 2. Increased tumorigenecity of MCF7S cells.
A. Histogram of CD44-FITC and Iso-FITC staining for MCF7P and MCF7S. Duplicates are shown. Percentages of CD44 positive staining (from 30,000 cells) are indicated. Representative scatter plot and gating of FACS sorted cells is shown as inset. B. In vivo tumorigenic assay for MCF7 parental and MCF7S tumorsphere cells. Five mice were used for each group.

