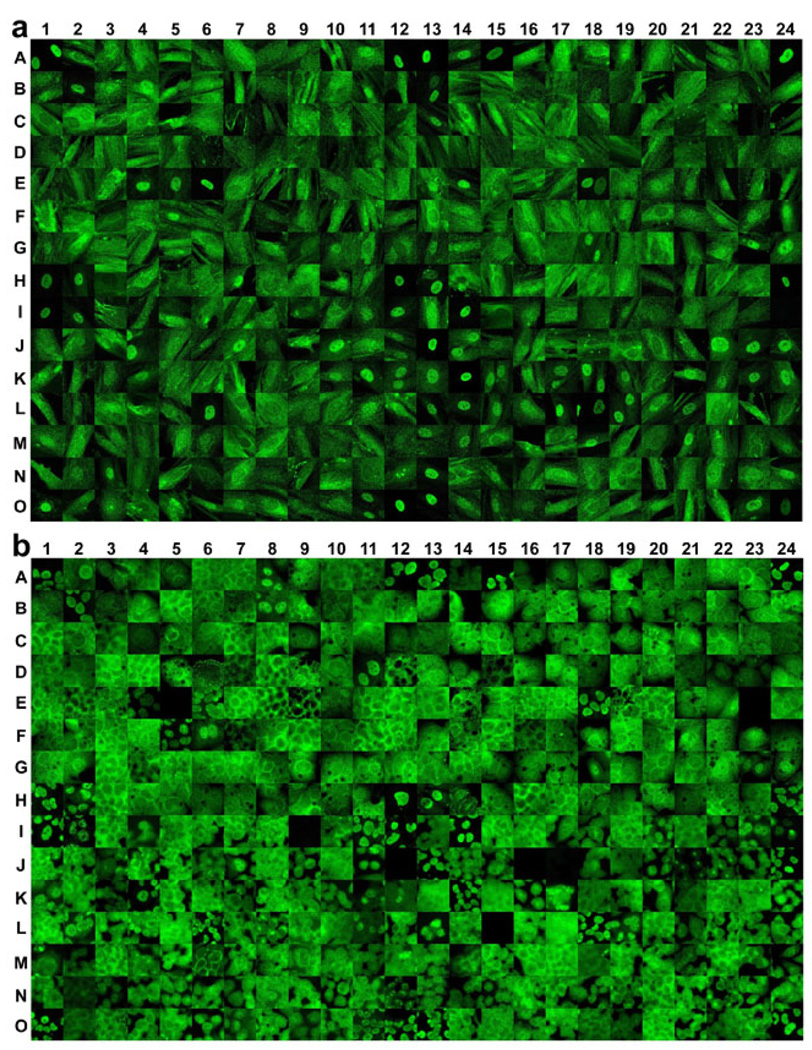
Fig 1. Chipview pictures of representative molecular images of 360 proteins in one benign breast cell line (Hs578Bst) (a) and in one breast cancer cell line (T-47D) (b) obtained by the DAMA staining technique.
The molecular images of 360 proteins obtained from DAMA staining were first imported to a database. Representative images were selected to construct the picture by using the ChipView program (Fig S2) and arranged in the same layout as the antibody list shown in Table S1. Each image represents the image of the corresponding protein in the sample tested. For those proteins whose molecular images at 63× magnification were not readable, black images were used.

