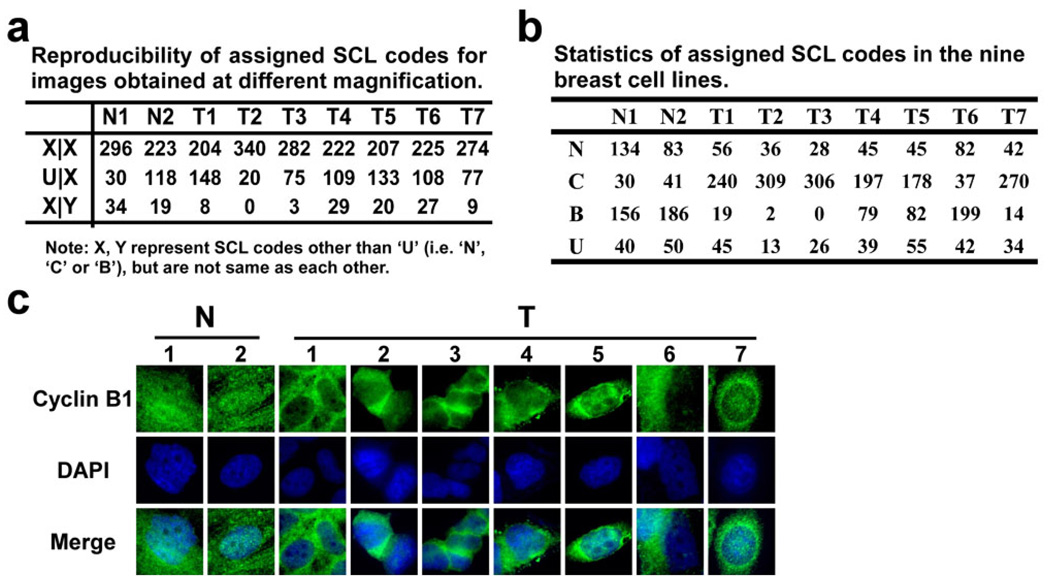
Fig 3. Summary of SCL profiles of 360 proteins in nine breast cell lines, as assigned from the images obtained with the DAMA staining technology.
a) Analysis of the reproducibility of the assigned SCL codes. Case 1 (X|X) represents those proteins which have the same assignments (not “U”) in both 20× and 63× images, case 2 (U|X) represents the proteins which have an uncertain assignment (“U”) in either 20× images or 63× images, and case 3 (X|Y), proteins which have certain assignments in both the 20× and 63× images, but are different from one another. b) Summary of the statistics of the assigned SCL distribution in nine breast cell lines. c) The molecular images of Cyclin B1 obtained from the DAMA staining in the nine breast cell lines possessing different SCL codes in benign and carcinoma derived cell lines. Labels for cell lines follow the same routine as in Figure 2.

