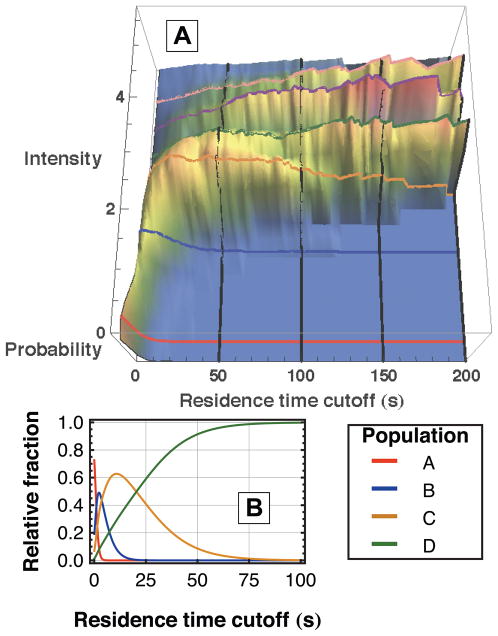
Figure 2.
Characteristic intensities exist for fibrinogen populations indicating different aggregation states. (A) The probability distribution of intensities on fused silica is shown as a function of the lowest residence time included in the distribution. Distinct ridges appear in the direction of increasing residence time cutoff that correspond to the values given in Table 2. (B) From the fit parameters to residence time data given in Table 1, the relative fractions of populations A–D are shown as a function of residence time cutoff. This helps to explain the growth and disappearance of the first 4 ridges in (A).

