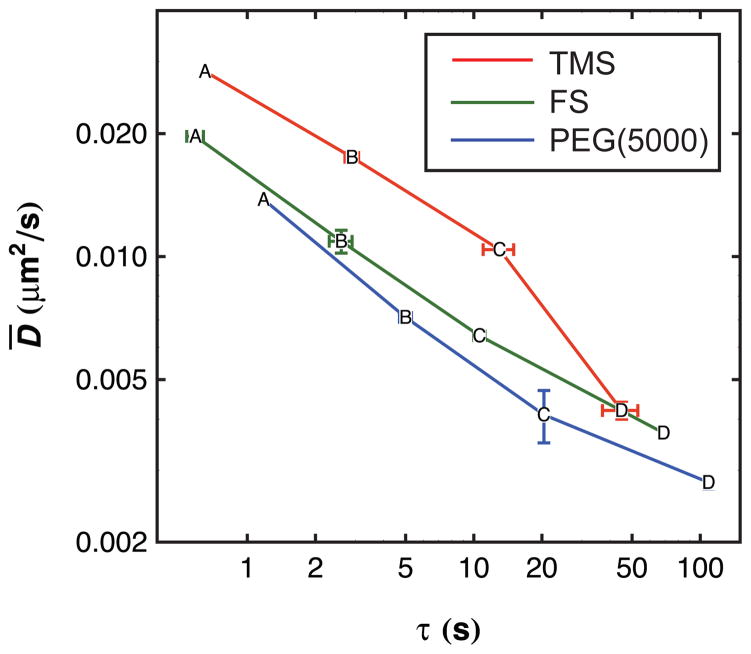
Figure 3.
The average diffusion coefficient is plotted on a log-log scale as a function of characteristic residence time for each population (labeled as “A” through “D”) on each surface. Error bars represent uncertainty in each coordinate where this value is larger than the data marker. Lines are drawn as a visual guide.

