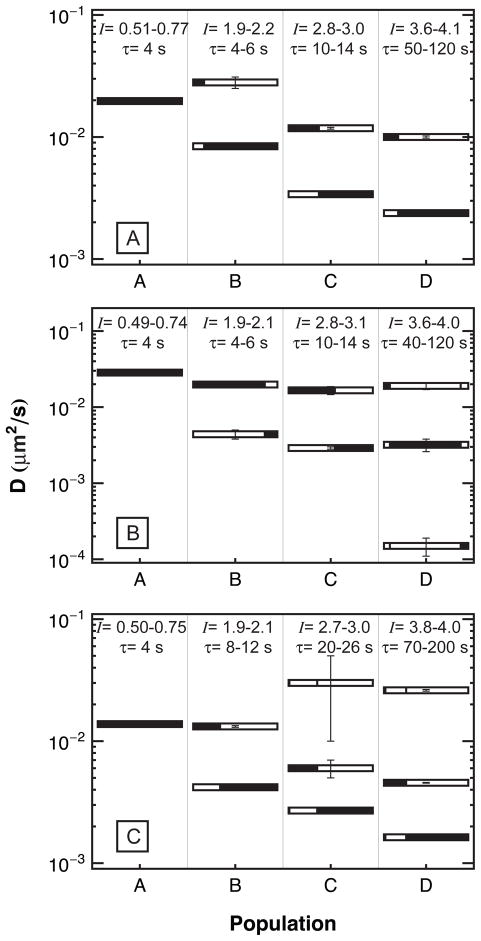
Figure 5.
The diffusion coefficients for the multiple diffusive modes of populations A through D are shown on different surfaces: (A) FS, (B) TMS, (C) PEG(5000). The black area of each bar represents the fraction of steps observed with the diffusion coefficient given by the bar’s position on the vertical axis. The intensity and residence time binning criteria used to define each population are shown along the top of each figure.

