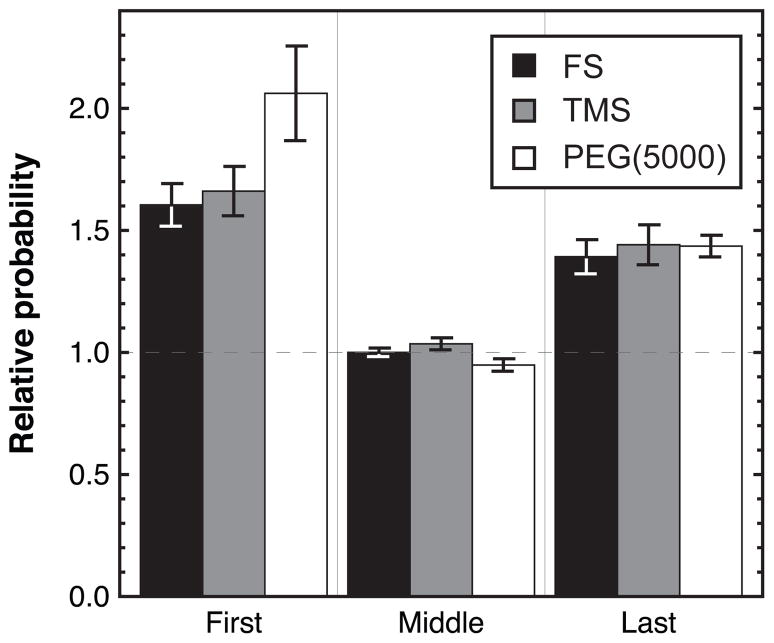
Figure 6.
The relative probabilities of a “large” step are shown for the first, middle and last steps in a trajectory on FS, TMS and PEG(5000). Probabilities are relative to the distribution of all observed steps and error bars represent the error introduced by choosing an arbitrary cutoff for a “large” step.

