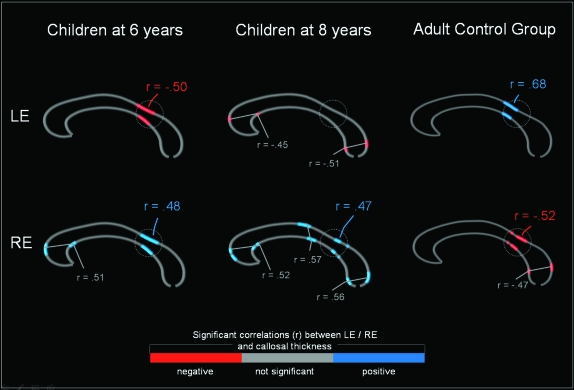
Figure 3.
Correlations between LE report and RE report and callosal thickness in different age groups. Displayed are the locations of significant negative (red) and positive (blue) correlations between callosal size and LE (upper row) and RE (lower row). The maps are displayed for children at the age of 6 years (left) and 8 years (middle), as well as for an adult control group (right). The maximum correlations (r) are provided for each of the regions in which a significant correlation (P < 0.05) was detected. The circle indicates the callosal isthmus.

