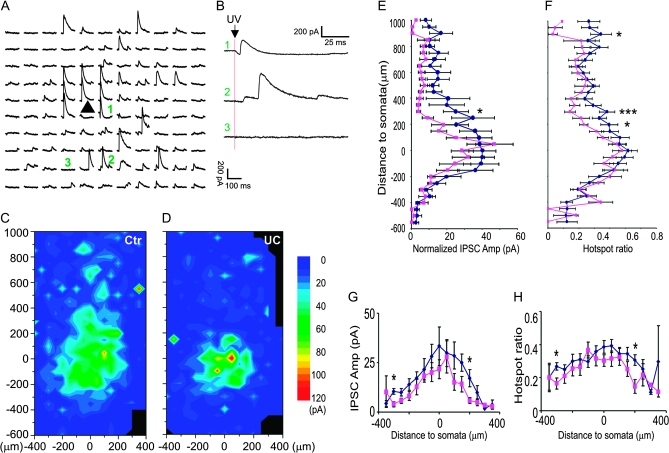
Figure 5.
Reduced inhibitory synaptic connectivity onto layer V Pyr neurons in the undercut cortex. (A and B) Recording traces in a central field of a representative map with 50 μm spacing. Traces labeled with green number are expanded and shown on the right in (B). At some uncaging sites, both direct activation and IPSCs were triggered (e.g., trace 1), whereas only IPSCs were evoked at other locations (e.g., trace 2). (C and D) Average maps illustrate the composite amplitude of detected IPSCs with onset within 100 ms of photostimulation in control (n = 21) and undercut cortex (D, n = 21). In the undercut cortex, the average area making inhibitory synaptic connection onto layer V Pyr neurons was smaller than that in the control. (E and F) Plots of region-normalized IPSC amplitudes (E) and hotspot ratio (F) versus vertical distance from the somata. There were significant decreases in region-normalized IPSC amplitude and hotspot ratio (P < 0.001 in both parameters, 2-way ANOVA). (G and H) Plot of mean composite EPSC amplitude (G) and hotspot ratio (H) evoked by uncaging stimuli in layer V showing significant decreases at several horizontal distances from the somata. x-axis positive and negative: lateral and medial to somata, respectively (P < 0.05, 2-way ANOVA).

