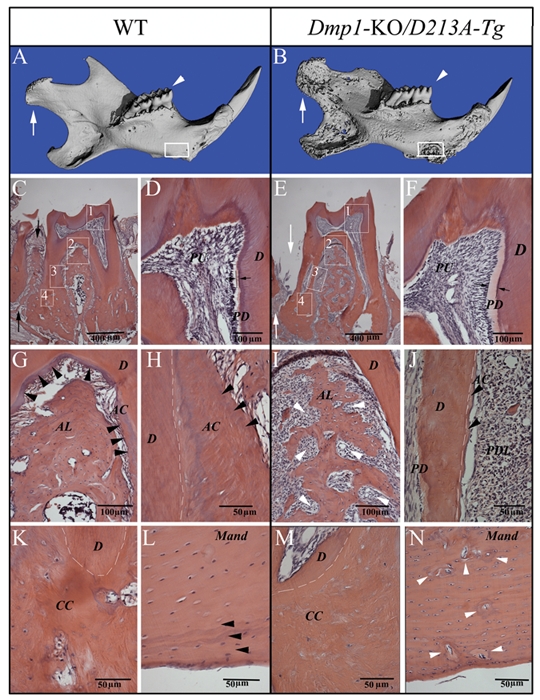
Figure 3.

Micro-CT images and H&E staining for the teeth and mandibles of one-year-old WT and Dmp1-KO/D213A-Tg mice. PD = predentin; D = dentin; PU = pulp; AC = acellular cementum; CC = cellular cementum; AL = alveolar bone; Mand = mandibular body. (A,B) Micro-CT images of the mandibles of one-year-old WT and Dmp1-KO/D213A-Tg mice: At the age of 1 yr, the phenotypic changes in the Dmp1-KO/D213A-Tg mouse mandible (B) became more remarkable than in the WT control (A) and more profound compared with the younger mice. The condyles were indicated by white arrows, the first molars analyzed by H&E staining were indicated by white arrowheads (C,E), and the mandibular areas analyzed by H&E staining were boxed (L,N). (C,E) H&E staining of the first molars of a one-year-old WT mouse and a one-year-old Dmp1-KO/D213A-Tg mouse. Note: Compared with the WT control (black arrows in C), the alveolar bone loss (white arrows in E) was obvious. (D,F) Higher magnification of the #1 boxed area (predentin and dentin) areas in C and E. Note: The predentin in the Dmp1-KO/D213A-Tg mouse molar (F) was wider than in the WT (D). (G,I) Higher magnification of the #2 boxed areas in C and E showing an enlarged view of the bifurcation region of the WT mouse and the Dmp1-KO/D213A-Tg mouse. Note the insufficient amounts of alveolar bone in the Dmp1-KO/D213A-Tg mice (white arrowheads in I). (H,J) Root region of the first molar (#3 boxed areas) from the WT mouse and the Dmp1-KO/D213A-Tg mouse. Note the presence of acellular cementum in the WT mouse and the lack of acellular cementum in the Dmp1-KO/D213A-Tg mouse (J). White dotted lines indicate the border between the root dentin and cementum. (K,M) H&E staining for the apical region of the first molar (#4 boxed areas) from the WT mouse and the Dmp1-KO/D213A-Tg mouse. (L,N) H&E staining for the mandibular body of the WT mouse and Dmp1-KO/D213A-Tg mouse. Note the presence of a normal lamellar bone structure in the surface areas of the WT mandibular body (black arrowheads in L); compared with the WT mouse, the mandibular body of the Dmp1-KO/D213A-Tg mouse had more osteoid (gray areas indicated by white arrowheads in N), enlarged osteocyte lacunae, and loss of lamellar bone structure in the surface area.
