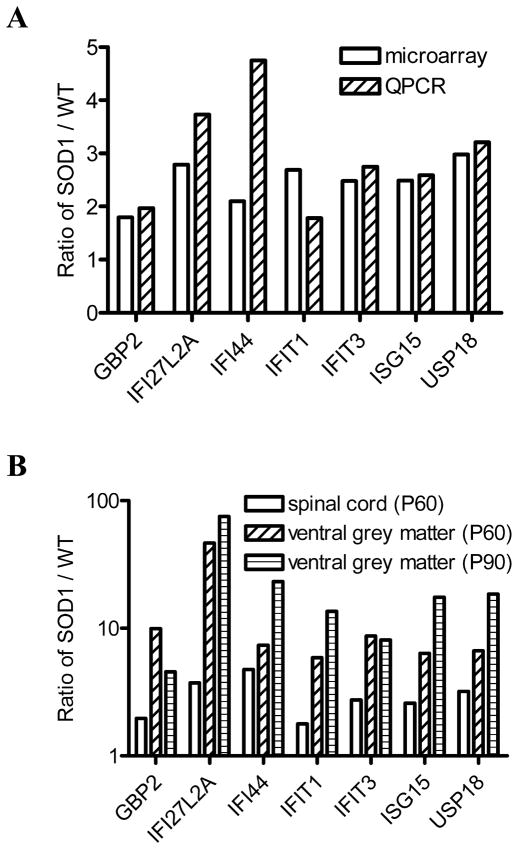
Fig. 1.
Up-regulation of ISGs in the SOD1(G93A) spinal cord. The ratio of SOD1/WT indicates the expression level of each gene. Data shown represent mean values. Both microarray and QPCR analysis showed that the seven ISGs had higher mRNA levels in P60 SOD1 mice (n = 3) than in wild-type littermates (n = 3) (A). mRNA levels were higher in the ventral grey matter than in the whole spinal cord of P60 SOD1 mice (n = 3) and P90 SOD1 mice (n = 3) (B).

