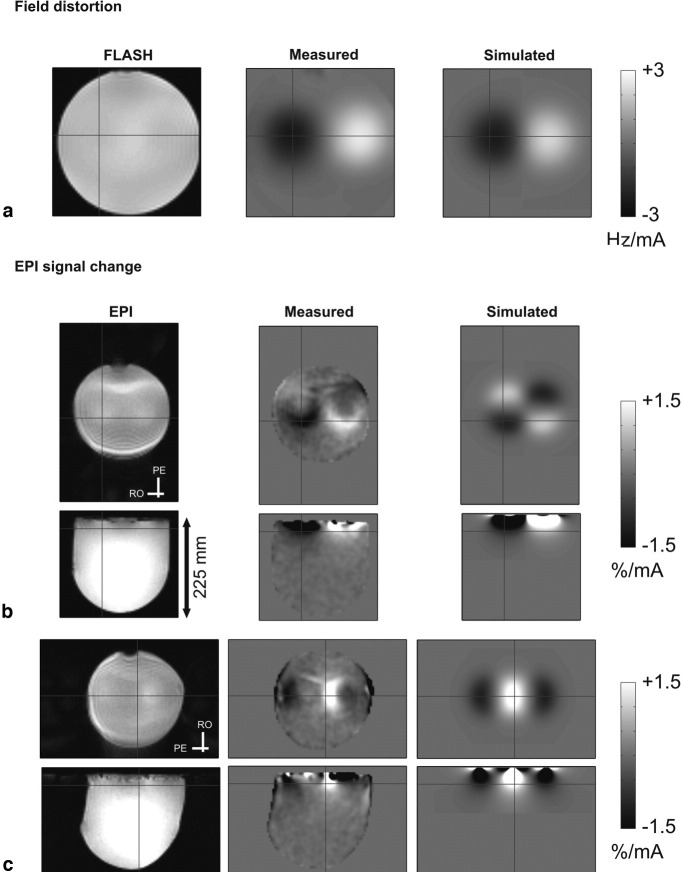
Figure 3.
Magnetic field changes and EPI intensity distortions caused by currents flowing through the TMS stimulation coil. Illustrative transverse slice ≈4 cm away from the center of the coil. a: Magnetic field changes expressed as frequency offsets (Hz) per mA current. FLASH magnitude image (left), plus measured (center), and simulated (right) frequency offset. b: Relative EPI signal changes per mA current applied to the TMS coil when the phase-encoding (PE) direction was anterior-posterior. EPI magnitude image (left), measured (center) and simulated (right) signal change. The bottom row shows coronal slices to appreciate how the level of artifacts decreased with increased distance from the TMS coil. c: Same as b, but the PE direction was left–right. An imperfect shim due to the nonspherical phantom geometry led to the clearly visible distortion in the EPI magnitude image (bottom row).

