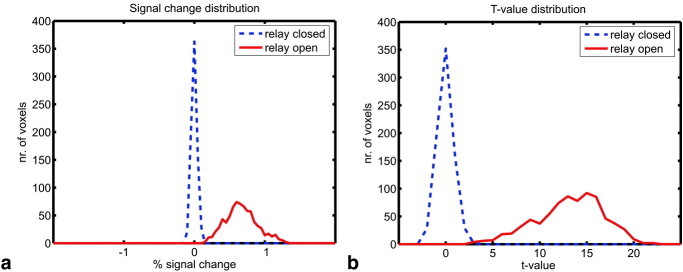
Figure 5.
Effects of TMS stimulator leakage currents and compensation by a bypass relay and diodes: analysis of the region of interest (ROI) defined in Fig. 4a (center). Histograms of (a) signal changes at the maximal stimulator output setting and (b) corresponding statistical t-values are plotted for all voxels within the ROI. The shifted means for measurements when the relay was open (solid red) indicate significant artifacts due to leakage currents. The zero means for measurements when the relay was closed (dashed blue line) indicate successful elimination of leakage current effects. [Color figure can be viewed in the online issue, which is available at www.interscience.wiley.com.]

