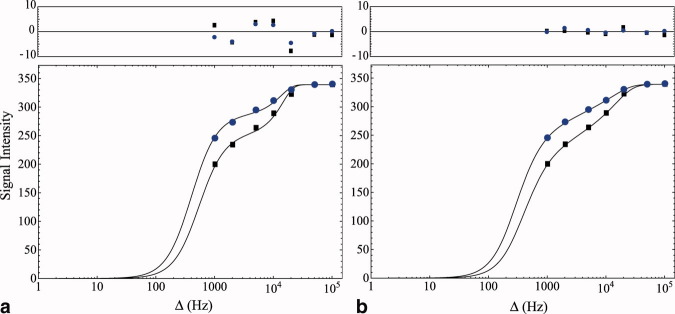
FIG. 3.
MT-weighted signal intensity plotted as a function of the MT pulse offset frequency for the two MT pulse amplitudes in the medial head of the gastrocnemius muscle of a single subject. Circles and squares: θnom = 350°,500°. Solid lines are a fit to the two-pool model signal equation. In (a), a Gaussian lineshape is used to describe the bound pool. In (b), a super-Lorentzian lineshape describes the absorption profile of the bound pool. The S-L lineshape provides a superior fit to the in vivo muscle data when compared with the Gaussian. The residual difference between the data and the fits are also plotted above the main graphs.

