Fig. 4.

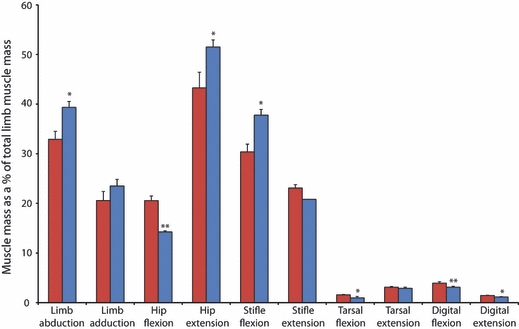
Functional distribution of muscle mass. Bars are means + SEs. Species comparison made by performing a Mann–Whitney U test (*P < 0.05; **P < 0.01). Cheetah values are in red and greyhound values in blue.

Functional distribution of muscle mass. Bars are means + SEs. Species comparison made by performing a Mann–Whitney U test (*P < 0.05; **P < 0.01). Cheetah values are in red and greyhound values in blue.