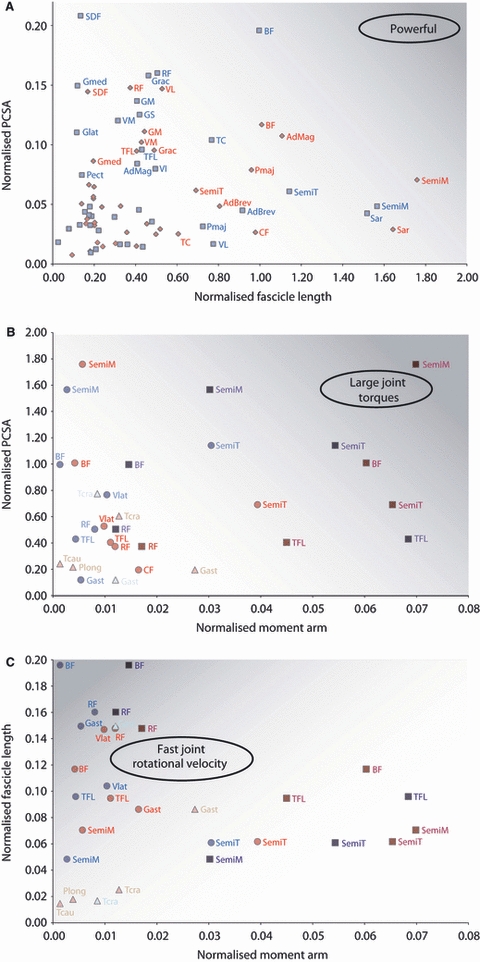
Fig. 7.

(A) Physiological cross-sectional area (PCSA) against fascicle length to illustrate the balance between force, range of motion/velocity and power output for different muscles. All architectural data was normalised geometrically to total limb muscle mass. (B) Moment arm against PCSA to illustrate the muscle's ability to produce large joint moments. (C) Moment arm against fascicle length to illustrate the muscle's ability to rotate the joint rapidly. All moment arm data were normalised to bone lengths. Darker shaded areas of the graphs represent increased power output (A), large joint torques (B) and faster joint rotational velocity (C). Cheetah values are represented in red and greyhound values in blue. In (B) and (C), muscles acting at the hip are represented by squares, those acting at the stifle by circles, and those acting at the tarsus by triangles. Muscle name abbreviations are given in Table 3.
