
Fig. 3.
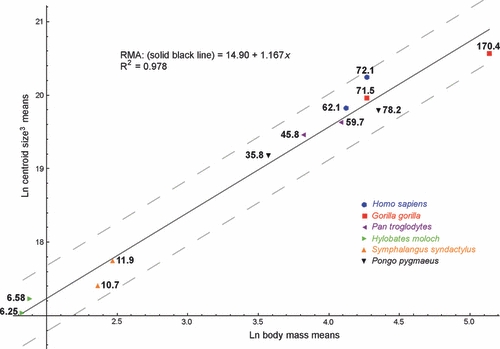
Scatterplot of ln-transformed cubed mean male and cubed mean female centroid size against ln-transformed mean male and mean female body mass (in kg) for six hominoid taxa. Numbers next to the dots represent the mean male (the larger figure in each taxon) and female body mass values (derived from Smith & Jungers, 1997). The solid line shows the regression model for all taxa. The grey dashed lines show the 95% confidence limits for the model.