
Fig. 7.
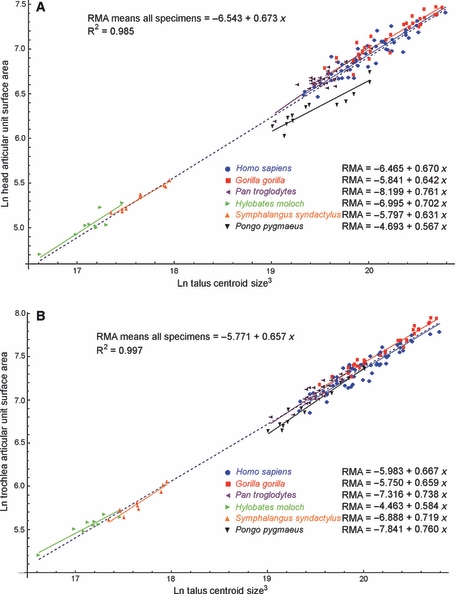
Scatterplots of: (A) ln-transformed surface area of the head articular unit (head, sustentaculum and calcaneo-navicular ligament facets combined); (B) ln-transformed surface area of trochlea articular unit (trochlea, medial and lateral facets combined) against ln-transformed cubed centroid size (CS3). The inter-specific regression models are shown by the dashed blue lines. Intra-specific regression models are shown by the solid colour-coded lines.