
Fig. 8.
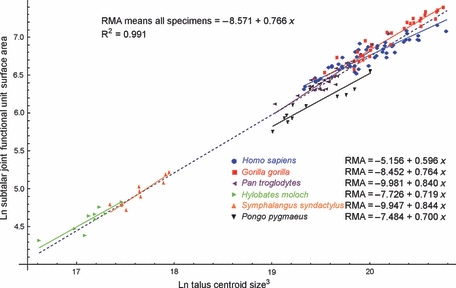
Scatterplot of ln-transformed combined surface areas of calcaneal and sustentaculum facets against ln-transformed cubed centroid size (CS3). The inter-specific regression model is shown by the dashed blue line. Intra-specific regression models are shown by the solid colour-coded lines.