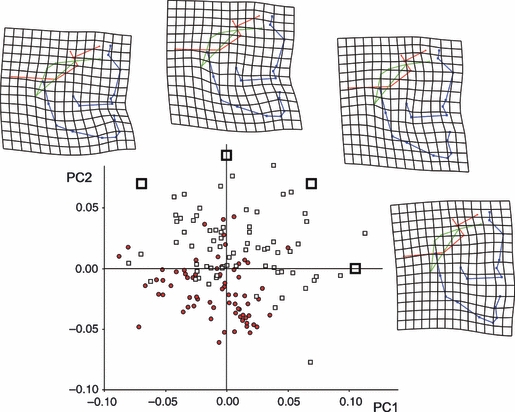
Fig. 2.

Scatter plot of the PC scores of the 142 specimens. The x-axis is the first PC axis, explaining 21.7% of the variance, the y-axis is the second PC axis, explaining 16.2% of the variance. Red circles: children, black squares: adults. The deformed grids illustrate the thin-plate spline interpolation of the entire form showing the transformations implied by changes along the PC axis 1 and 2 scores (right and middle top), as well as the combination of the axes (top left and top right). The large squares show the position of each specimen that corresponds to the deformation showed by each nearby TPS grid.
