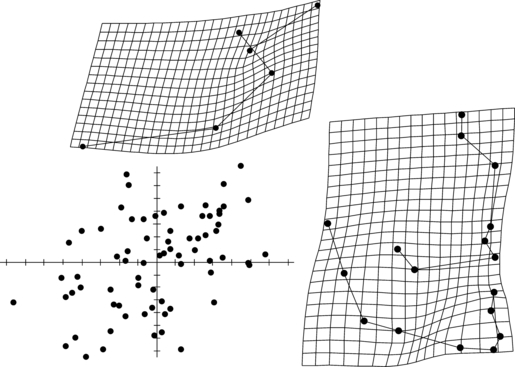
Fig. 7.

Plot of singular axis 2 scores for the face (x-axis) and the lateral cranial base (y-axis) in adults, explaining 31.5% of total covariance, after removing allometry. The associated TPS transformation grids show the pattern of covariance between these structures.
