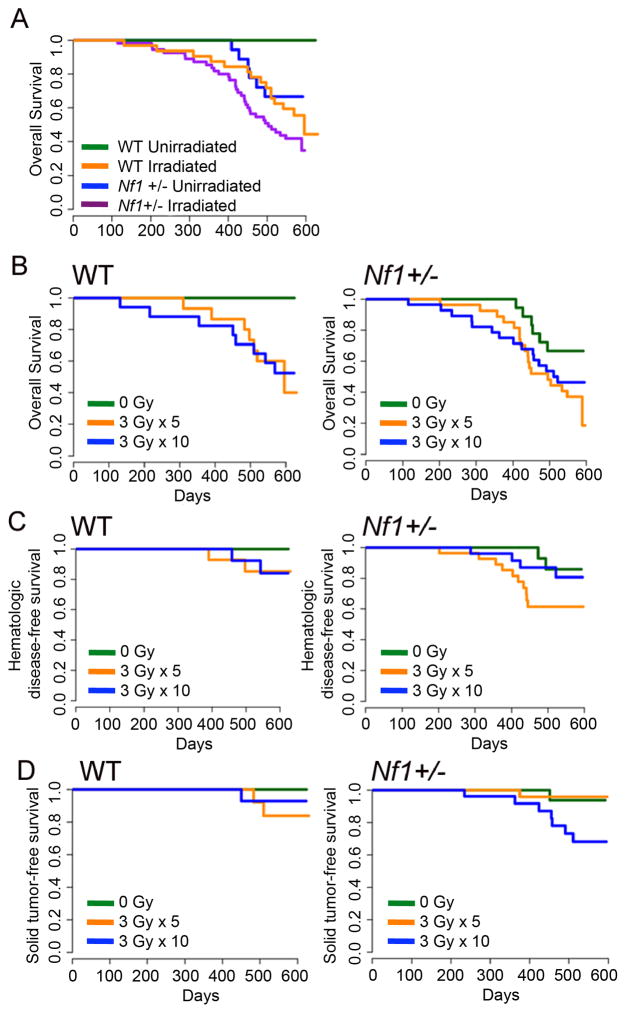
Figure 1. Overall Survival and Disease-Specific Survival after CI.
Kaplan-Meier survival curves were used to depict overall survival, solid tumor free survival, and hematologic disease free survival in WT and Nf1 mutant mice. Log-rank tests were used to test for differences between survival curves. The latency to death was measured from the date of the last radiation fraction. A and B. WT and Nf1 mutant mice had decreased survival after CI. C and D. Kaplan-Meier cause-specific survival curves were generated to reflect death due to hematologic malignancies or solid tumors. Nf1+/− mice exposed to 15 Gy CI were significantly more likely to die with hematologic disease than those that were unirradiated or exposed to 30 Gy CI (HR 4.151, 95% CI: 0.9081–18.971, p=0.0465). D. Nf1+/− mice exposed to 30 Gy CI were significantly more likely to die of solid tumors than mice that were unirradiated or exposed to 15 Gy CI (HR 1.659, 95% CI: 0.3037 – 9.058, p=0.04).

