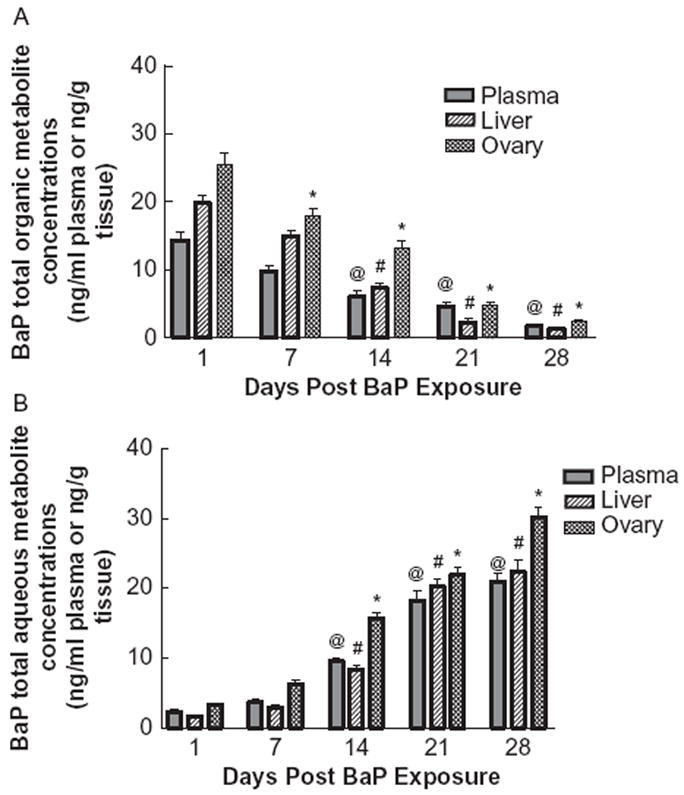
FIGURE 1.

Time-course distribution of (A) total BaP organic metabolites and (B) aqueous metabolites in plasma, ovaries, and liver of F-344 rats that received BaP via oral gavage. Values represent mean ± SE (n = 6). The symbols (@, #, and *) denote statistical significance (p < .05) in metabolite concentrations in plasma or liver or ovaries at the respective time point compared to d 1 postexposure.
