
FIGURE 2.
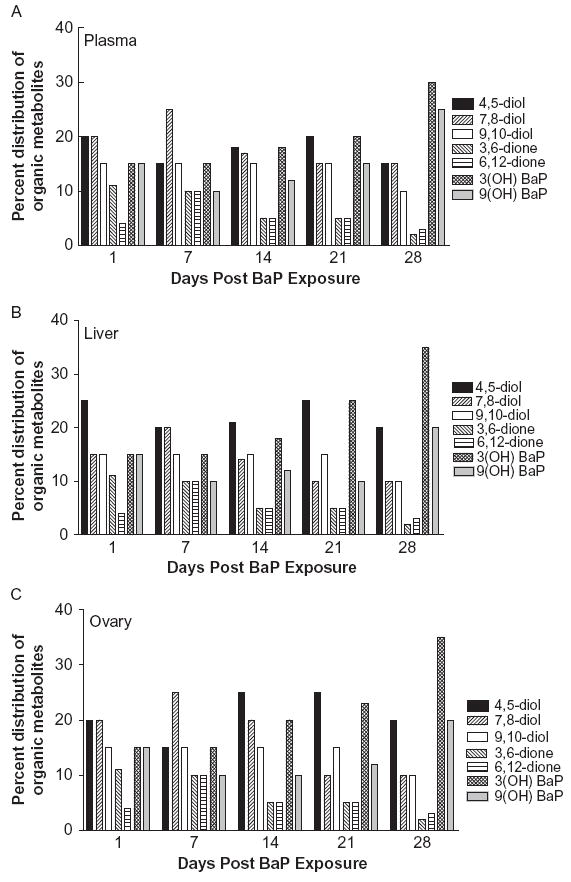
Distribution (%) of individual BaP organic metabolite types in plasma (A), ovaries (B), and liver (C) of F-344 rats that received BaP via oral gavage.
Official websites use .gov
A
.gov website belongs to an official
government organization in the United States.
Secure .gov websites use HTTPS
A lock (
) or https:// means you've safely
connected to the .gov website. Share sensitive
information only on official, secure websites.
Distribution (%) of individual BaP organic metabolite types in plasma (A), ovaries (B), and liver (C) of F-344 rats that received BaP via oral gavage.