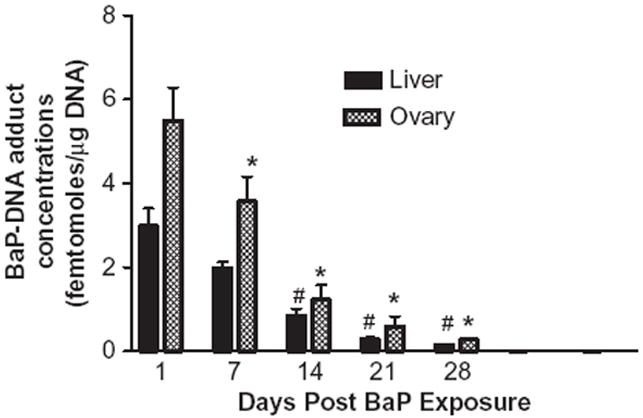
FIGURE 4.

Time-course distribution (persistence) of BaP–DNA adducts in ovaries and liver of F-344 rats that received BaP via oral gavage. DNA was extracted from these samples, BaP-derived adducts were 32P-postlabeled, and TLC was performed as described in the Materials and Methods section. Films were exposed for 24 h at −80° C. Values represent mean ± SE (n = 6). The symbols (# and *) denote statistical significance (p < .05) in adduct concentrations in liver or ovaries at the respective time point compared to d 1 postexposure.
