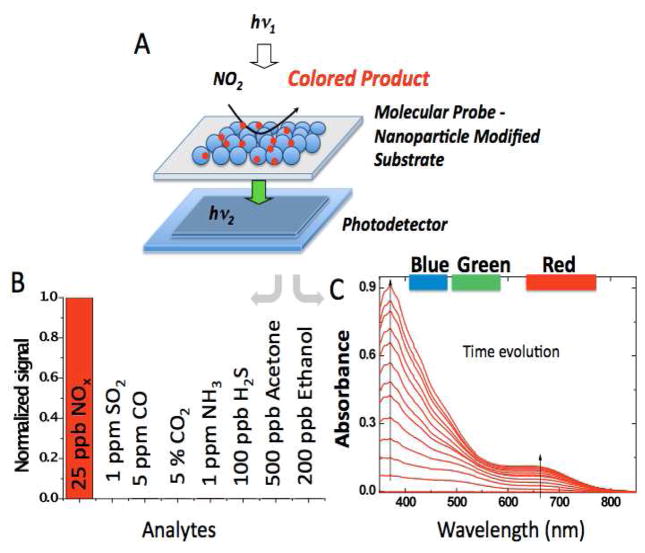
Figure 1.
A) Schematic representation of the sensing platform. B) Normalized response of o-phenylenediamine upon exposure to NO2 and various environmental gases. A similar response pattern is found for diethyl-p-phenylenediamine. C) UV-Visible spectrum of o-phenylenediamine upon reaction with NO2 (part-per-million (ppm) level) taken at increasing reaction times.

