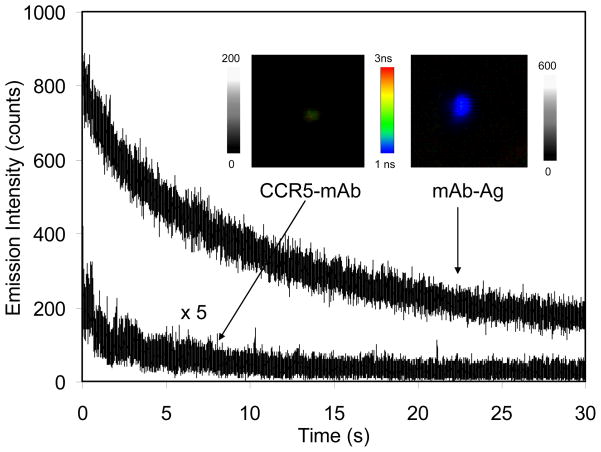
Figure 1.
Representative time traces of single labeled anti-CCR5 mAb and mAb-metal complex upon excitation at 635 nm. The insets represent the respective typical fluorescence images of them in the both emission intensity and lifetime. The scales of diagrams are 5 × 5 μm and the resolutions are 100 × 100 pixel with an integration of 0.6 ms/pixel.

