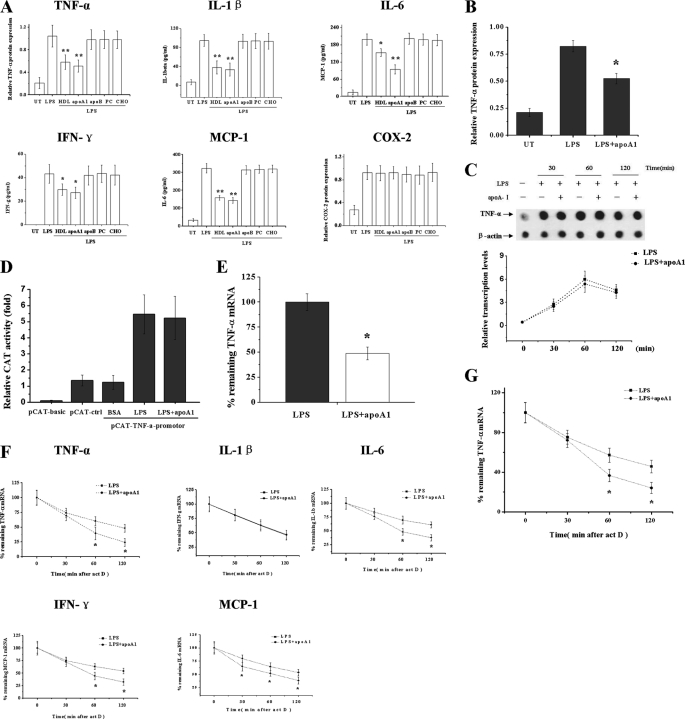
FIGURE 1.
ApoA-I suppresses LPS-induced inflammatory cytokine expression in macrophages through increasing the mRNA decay. A, THP-1 macrophages were treated with LPS for 6 h with or without pretreatment of native HDL, apoA-I, apoB, phosphatidylcholine, and cholesterol for 3 h, and TNF-α and COX-2 levels were determined by Western blots and compared with β-actin. The concentrations of IL-1β, IL-6, IFN-γ, and MCP-1 were measured by ELISA. *, p < 0.05 versus LPS group. **, p < 0.01 versus LPS group. UT, untreated. B, human primary macrophages were treated with LPS for 6 h with or without pretreatment of apoA-I for 3 h, and TNF-α levels were determined by Western blots. *, p < 0.05 versus LPS group. C, THP-1 macrophages were treated with LPS for 30, 60, and 120 min with or without pretreatment of apoA-I. Nuclei were isolated from cells, and run-on reactions were performed. Nuclear RNAs were isolated and hybridized to membranes containing cDNA of TNF-α and β-actin (as a control). D, CAT reporter vector of basic, control, and TNF-α promoter were cotransfected with pCMV vector into THP-1 cells. The CAT and β-galactosidase activity were assayed by ELISA, and the relative CAT activity was determined as a ratio of CAT/β-gal. E, TNF-α mRNA levels were measured by RT-PCR and normalized to the levels of β-actin, *, p < 0.05 versus LPS group. F, THP-1 macrophages were treated with LPS alone or with apoA-I for 3 h followed by addition of act D (5 μg/ml) to stop transcription. After the indicated time points, cytokines mRNA were quantified using RT-PCR and normalized to β-actin expression. Remnant cytokine mRNA in percentage of the amount at the time point 0 of act D treatment was depicted, *, p < 0.05 versus LPS group. G, human primary macrophages were treated with LPS alone or with pretreatment of apoA-I for 3 h, and TNF-α mRNA decay rate was determined by the method mentioned above. All of the data represent the mean ± S.E. from three separate experiments with triplicate samples.

