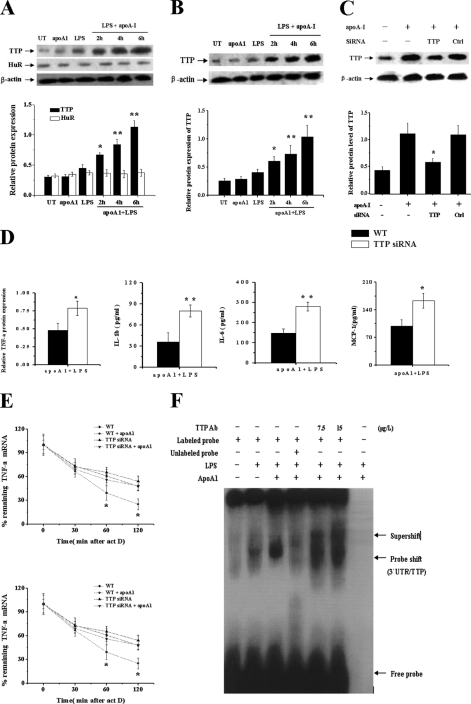
FIGURE 3.
ApoA-I-induced TTP expression limits expression of some inflammatory cytokines in LPS-stimulated macrophages. A, THP-1 macrophage-derived foam cells; B, human primary macrophages were treated with LPS or apoA-I for 4 h or with LPS + apoA-I for different times (2, 4, and 6 h). Total protein extracts from cells were subjected to Western blot analyses for TTP and HuR. *, p < 0.05 versus LPS group. **, p < 0.01 versus LPS group. C, THP-1 macrophages were transfected with control (WT) or TTP siRNA for 48 h, and protein samples were immunoblotted with TTP and β-actin antibodies. *, p < 0.05 versus WT cells treated by apoA1. D, THP-1 macrophages transfected with control (WT) or TTP siRNA were treated by LPS alone or with apoA-I for 6 h, and the levels of cytokines were measured. *, p < 0.05 versus WT group; **, p < 0.01 versus WT group. E, THP-1 macrophages transfected with control (WT) or TTP siRNA were treated by LPS alone or with pretreatment of apoA-I for 3 h followed by addition of act D (5 μg/ml) to stop transcription. After the indicated time points, TNF-α and IL-6 mRNA were quantified using RT-PCR. Values were normalized against β-actin. Remnant TNF-α mRNA in percentage of the amount at the time point 0 of act D treatment was depicted. *, p < 0.05 compared with other groups. F, protein extracts (30 μg) of variously treated THP-1 cells were analyzed for in vitro binding of TTP to biotin-labeled RNA probe (3′-UTR AREs of TNF-α, 80 bp, 2 nm) using RNA EMSA. 1st lane, free probe; 2nd lane, LPS; 3rd lane, LPS + apoA-I; 4th lane, LPS + apoA-I + 200× 3′-UTR ARE cold probe; 5th lane, LPS + apoA-I + TTP Ab (7.5 μg/liter); 6th lane, LPS + apoA-I + TTP antibody (15 μg/liter); 7th lane, negative control with protein and TTP antibody. All of the data represent the mean ± S.E. from three separate experiments with triplicate samples.

