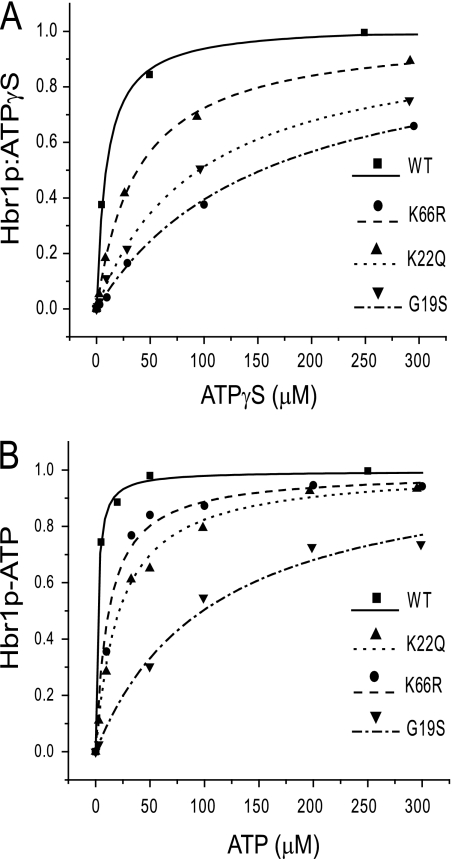
FIGURE 4.
Equilibrium binding of ATP to WT and mutant Hbr1p-His6. A, equilibrium dialysis of Hbr1p and radiolabeled [γ-35S]ATP displaced with nonlabeled ATPγS is represented as the concentration of ATPγS bound to Hbr1p versus free ATPγS. The data points are represented by symbols, and the calculated single site homogenous binding isotherms are represented as lines. B, equilibrated mixtures of Hbr1p-His6, radiolabeled [γ-32P]ATP, and competing amounts of nonlabeled ATP were column-filtered to separate free ATP from bound. The equilibrium isotherm is represented as the concentration of ATP bound Hbr1p-His6 versus free ATP using symbols for data and lines for fits.

