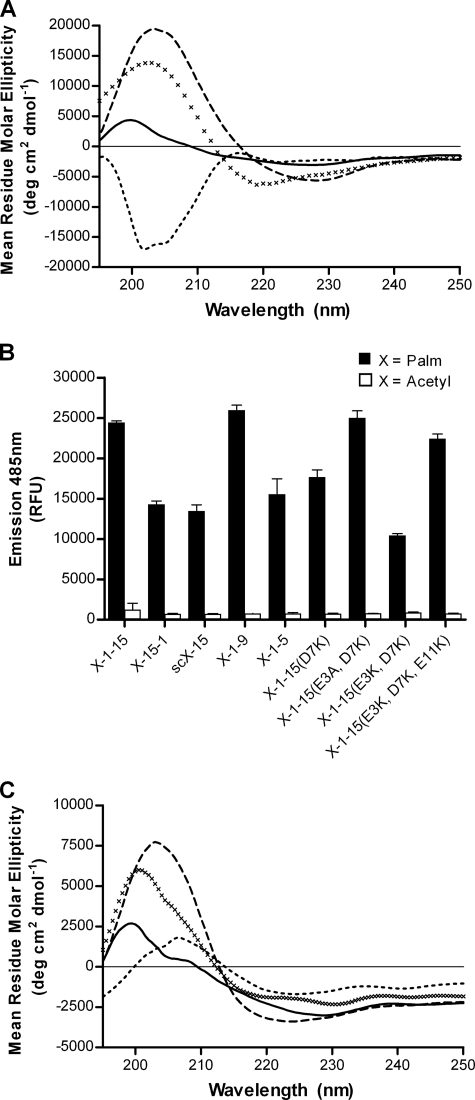
FIGURE 2.
Conformational analyses of various N- and C-terminal dipalmitoylated peptides of different primary sequence. A, CD spectra of liposomal peptides Palm15–1 (solid line), scPalm15 (dashed line), Palm1–9 (×), and Palm1–5 (dotted line). B, ThT fluorescence emission upon the addition to liposomes embedded with different sequences of N- and C-dipalmitoylated peptides (filled bars) and corresponding “native” acetylated peptides (open bars) in the absence of liposomes. Results are given as average ± S.D. (error bars) (n = 3). C, CD spectra of liposomal peptides Palm1–15(D7K) (solid line), Palm1–15(E3A,D7K) (dashed line), Palm1–15(E3K,D7K) (×), and Palm1–15(E3K,D7K,E11K) (dotted line). RFU, relative fluorescence units.

