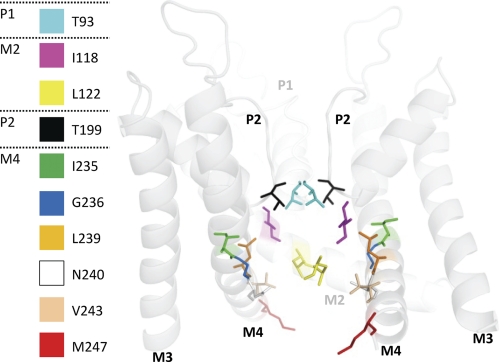
FIGURE 6.
Open-state pore homology model of TASK-1 based on the KvAP structure. The figure illustrates residues identified as pore-facing using A1899. For better display, the backbone of half a TASK-1 subunit (M1, P1 and M2) is hidden, whereas the identified residues are still depicted. The backbone is shown transparent for a better view on the residues of the drug binding site.

