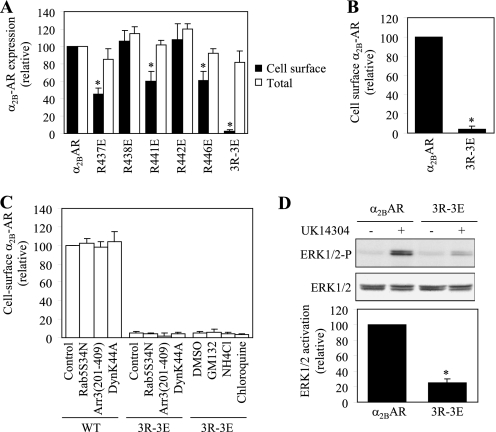
FIGURE 5.
Effect of mutating tubulin binding sites on the cell surface expression of α2B-AR. A, cell surface and total expression of wild-type α2B-AR and its mutants in which five Arg residues were mutated individually or in combination. HEK293 cells were transfected with GFP-tagged α2B-AR or its mutants. The expression of the receptors at the cell surface was determined by intact cell ligand binding using [3H]RX821002 and the total receptor expression was determined by flow cytometry detecting the GFP signal as described under “Experimental Procedures.” The data shown are percentages of the mean value obtained from cells transfected with α2B-AR and are presented as the mean ± S.E. of three experiments. *, p < 0.05 versus α2B-AR. B, cell surface expression of α2B-AR and its mutant 3R-3E. HEK293 cells were transfected with HA-tagged α2B-AR or its mutant 3R-3E and their expression at the cell surface was determined by flow cytometry following staining by anti-HA antibodies as described in “Experimental Procedures.” The data shown are percentages of the mean value obtained from cells transfected with α2B-AR and are presented as the mean ± S.E. of four experiments. *, p < 0.05 versus α2B-AR. C, effect of blocking endocytotic transport and degradation on the cell surface expression of α2B-AR and its mutant 3R-3E. HEK293 cells were co-transfected with α2B-AR or the mutant 3R-3E together with pcDNA3 vector (control) or the dominant negative mutants Arr3(201–409), DynK44A, or Rab5S34N. For drug treatment, HEK293 cells transfected with the mutant 3R-3E were treated with DMSO (control), GM132 (20 μm), NH4Cl (20 mm), or chloroquine (100 μm) for 6 h at 37C°. The data shown are presented as the mean ± S.E. of three separate experiments. D, activation of ERK1/2 by α2B-AR and its mutant 3R-3E. HEK293 cells were transfected with α2B-AR or the mutant 3R-3E and stimulated with UK14304 at a concentration of 1 μm for 5 min at 37 °C. ERK1/2 activation was determined by Western blot analysis using phospho-specific ERK1/2 antibodies. Upper panel: a representative blot showing ERK1/2 activation; middle panel: total ERK1/2 expression; lower panel: quantitative data expressed as percentages of ERK1/2 activation obtained from cells transfected with α2B-AR and presented as the mean ± S.E. of three experiments. *, p < 0.05 versus α2B-AR.

